Stanford Wehab Lab
Building and evaluating a device for nasal cycle detection
I spent the summer after my freshman year working at the Stanford Psychophysiology Lab (Wehab Lab). This was a part of the CURIS (undergraduate research in computer science) fellowship.
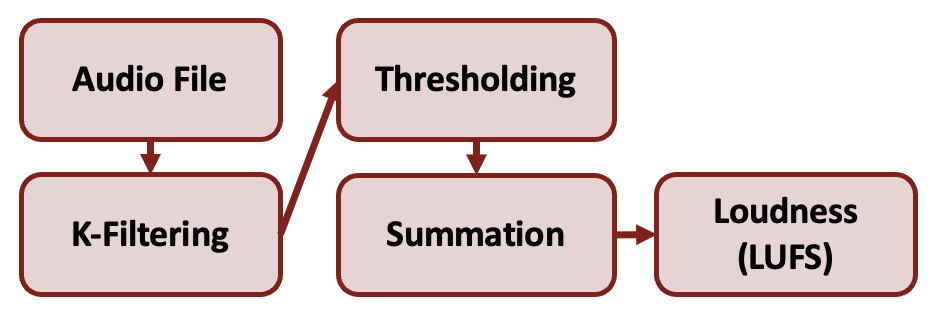
My work involved using Arduino to construct and evaluate a palatal PPG and microphone apparatus for nasal cycle detection. I developed a pipeline that was capable of calculating loudness measurements and FFT frequency analyses using the collected nasal exhalation data.
Technologies used:
- Arduino
- Python (numpy, scipy, matplotlib, pandas, sklearn)
Background
The nasal cycle refers to spontaneous congestion and decongestion of opposite sides of the nose.
- Common in mammals, present in ~80% of the human population
- Periodic in nature, shifts in the cycle are individual dependent but range from 0.5-2.5 hours on average
Congestion is controlled by tissue-covered flaps in the nose known as turbinates, and turbinate enlargement results in restricted nostril airflow.
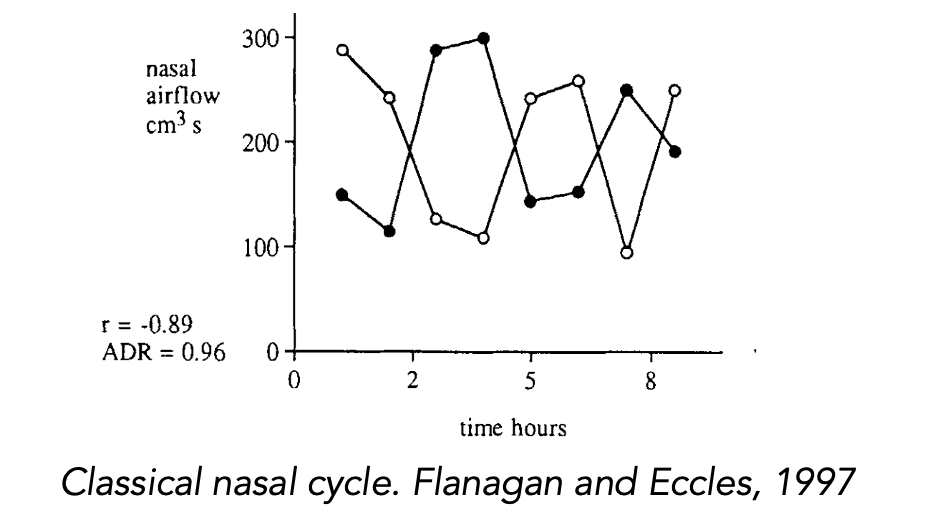
Studies show potential links between the nasal cycle and autonomic nervous system functioning, respiratory infection response, and mental/emotional disorders, motivating further research into nasal cycle detection methods.
Proposed Solution
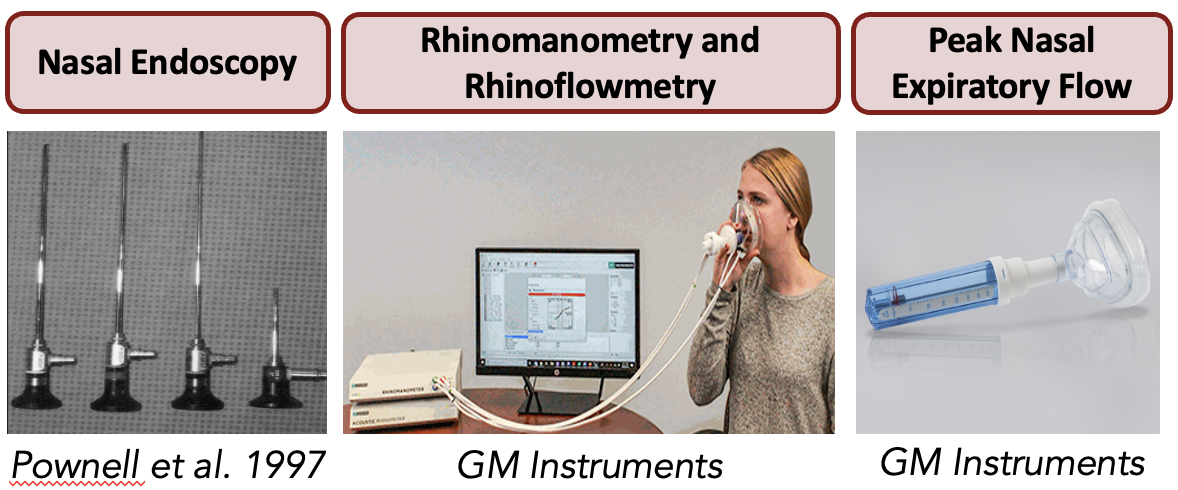
Current methods are invasive, expensive, or constrained by the necessity to operate in a lab/clinical setting.
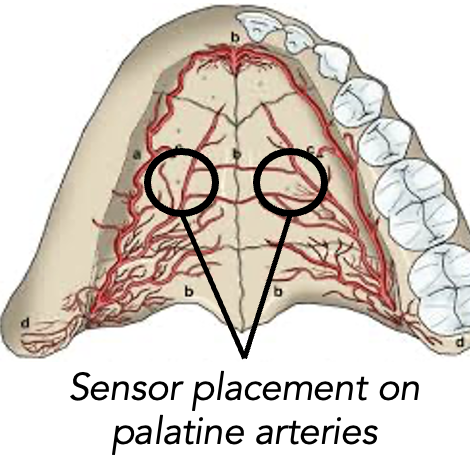
We aim to create a self-contained retainer that uses photoplethysmography (PPG) sensors to analyze blood flow in the greater palatine arteries, which supply blood to the inferior turbinates.
Furthermore, we want to verify the existence of the nasal cycle with audio-based methods and determine alignment between our two approaches.
Our goals are to create prototypes that are:
- Portable/practical for long-term data collection
- Cost effective
- Comfortable and non-invasive
Methodology and Results
Phase 1: Turbinate Enlargement Dectection with PPG Sensors
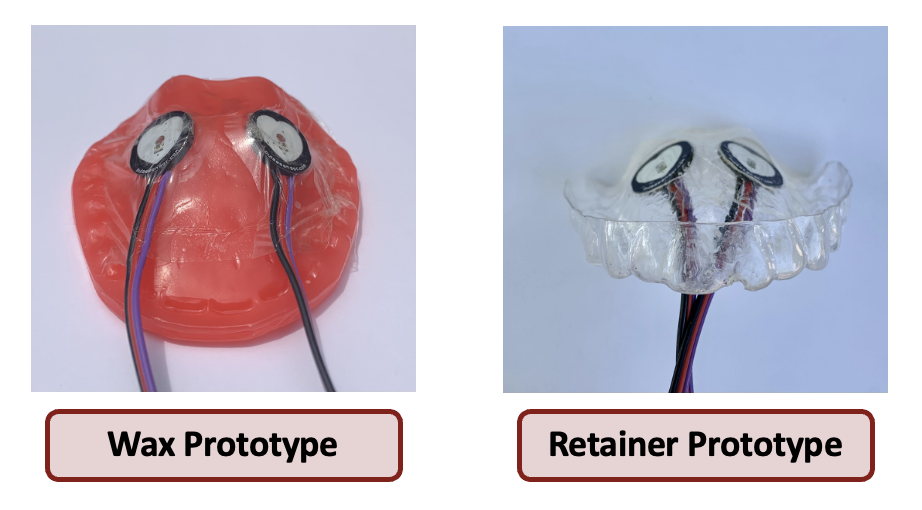
- Placed two PPG sensors on the prototype base
- Tested with dental wax and retainer designs
- Aligned sensors slightly in front of the first molar on either side
- Lateral positioning matched branching of the greater palatine artery
- Fastened sensors using waterproof tape for safety purposes
- Connected sensors to an Arduino-compatible microcontroller
Phase 2: Nostril Dominance Detection with Microphone
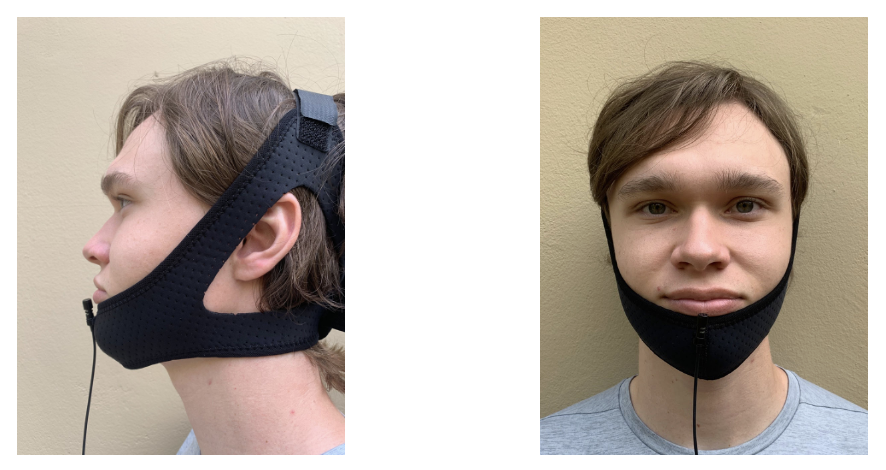
- Attached an omnidirectional lapel microphone to a sleep apnea chin strap
- Maintained a consistent angle towards and distance from each nostril
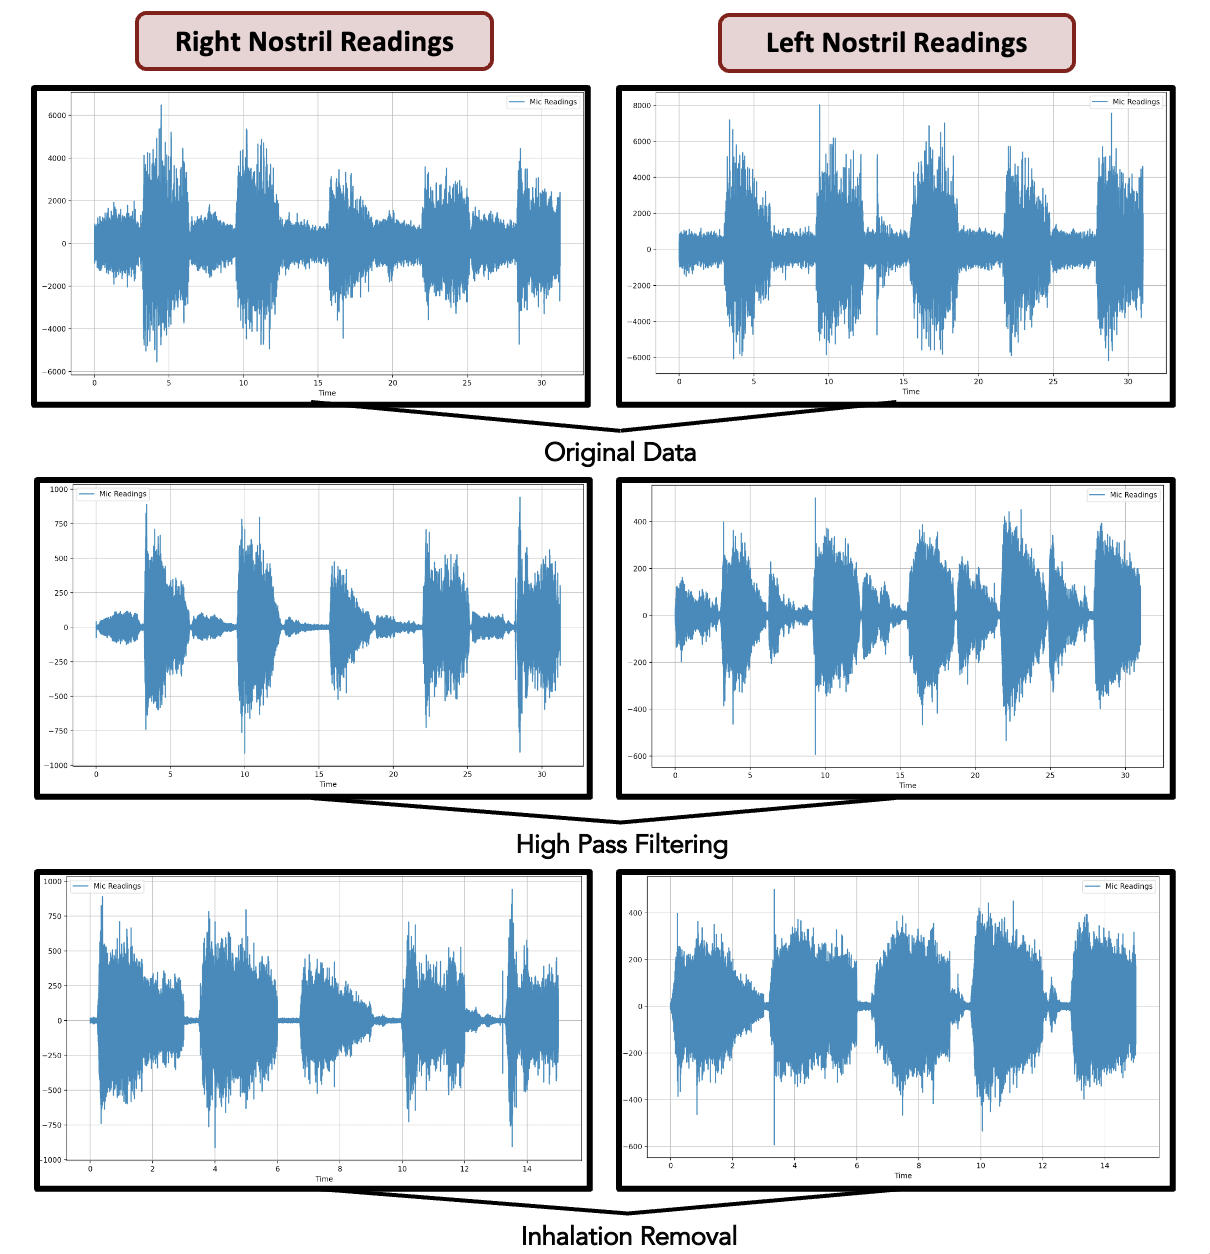
- Covered one nostril using a finger
- Performed five inhalation-exhalation sets timed at three seconds each
- Recorded audio data with the microphone, processed data, and calculated integrated loudness for each resulting audio file
Discussion
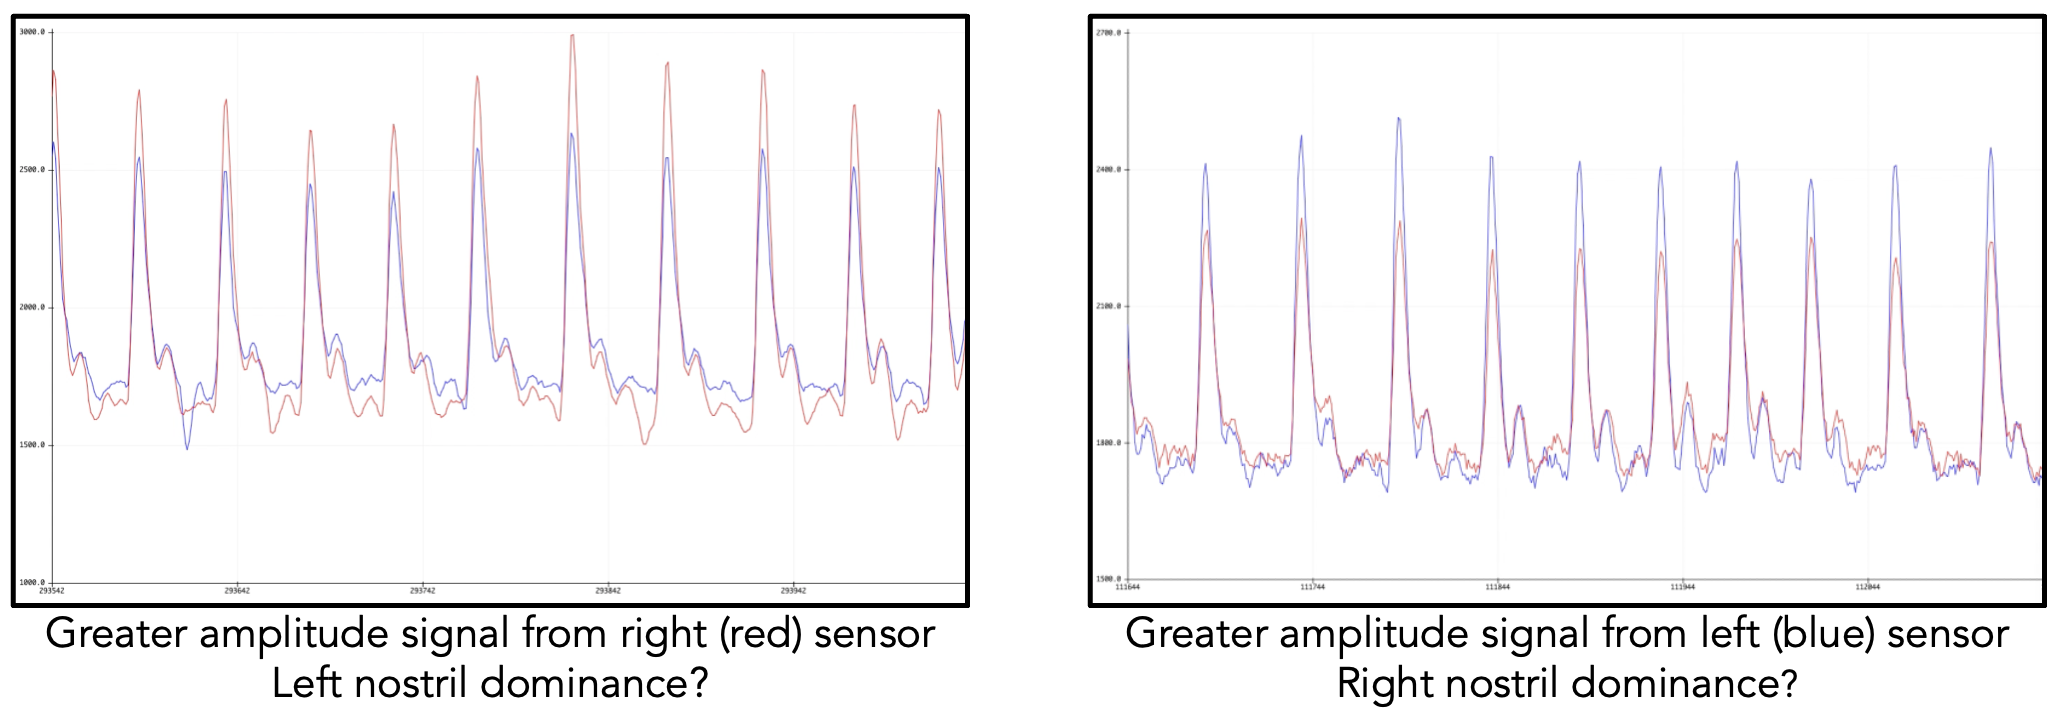
We conducted experimentation by blocking a nostril or laying sideways, thus forcing one nostril to dominate breathing over the other. Trials from both PPG-based prototypes were inconclusive.
-
No replicable or statistically significant relationship between PPG readings and nostril airflow
-
Laying on one side to force blood flow did not result in a shift between the amplitudes in the readings
-
Readings were heavily impacted by sensor placement and pressure against the artery
-
Turbinate enlargement is one of many factors contributing to the nasal cycle, and the greater palatine artery is only connected to one of three nasal turbinates
-
Preliminary testing and analysis with the microphone readings were more promising.
-
Testing apparatus resulted in replicable measurements across trials
-
There was alignment between computed loudness measurements and peak nasal expiratory flow measurements (our gold standard)
Future Work
The retainer showed a higher amplitude from the right sensor in every trial. This is due to sensor placement (aligning a flat sensor to the curved palate) or sensor error.
- We developed a flexible PPG sensor to place on the retainer and are awaiting its arrival for testing
For the microphone readings, the loudness values are difficult to interpret as a standalone metric, and further measures can be taken to clean the data. We can:
- Compare the energy in each audio signal
- Utilize a baseline frequency (e.g. a 1 kHz tone) to establish a relative scale such that LUFS and dB values can be more accurately compared
- Record ambient noise in the room and filter it out
Further exploration:
- Compare results with a rhinomanometer which is the academic convention for nasal cycle detection
- Use a temperature sensor to check cyclic nasal mucous temperature differentials
- Use a pressure sensor to check for cyclic air pressure changes
